PET 2026 · CSAT
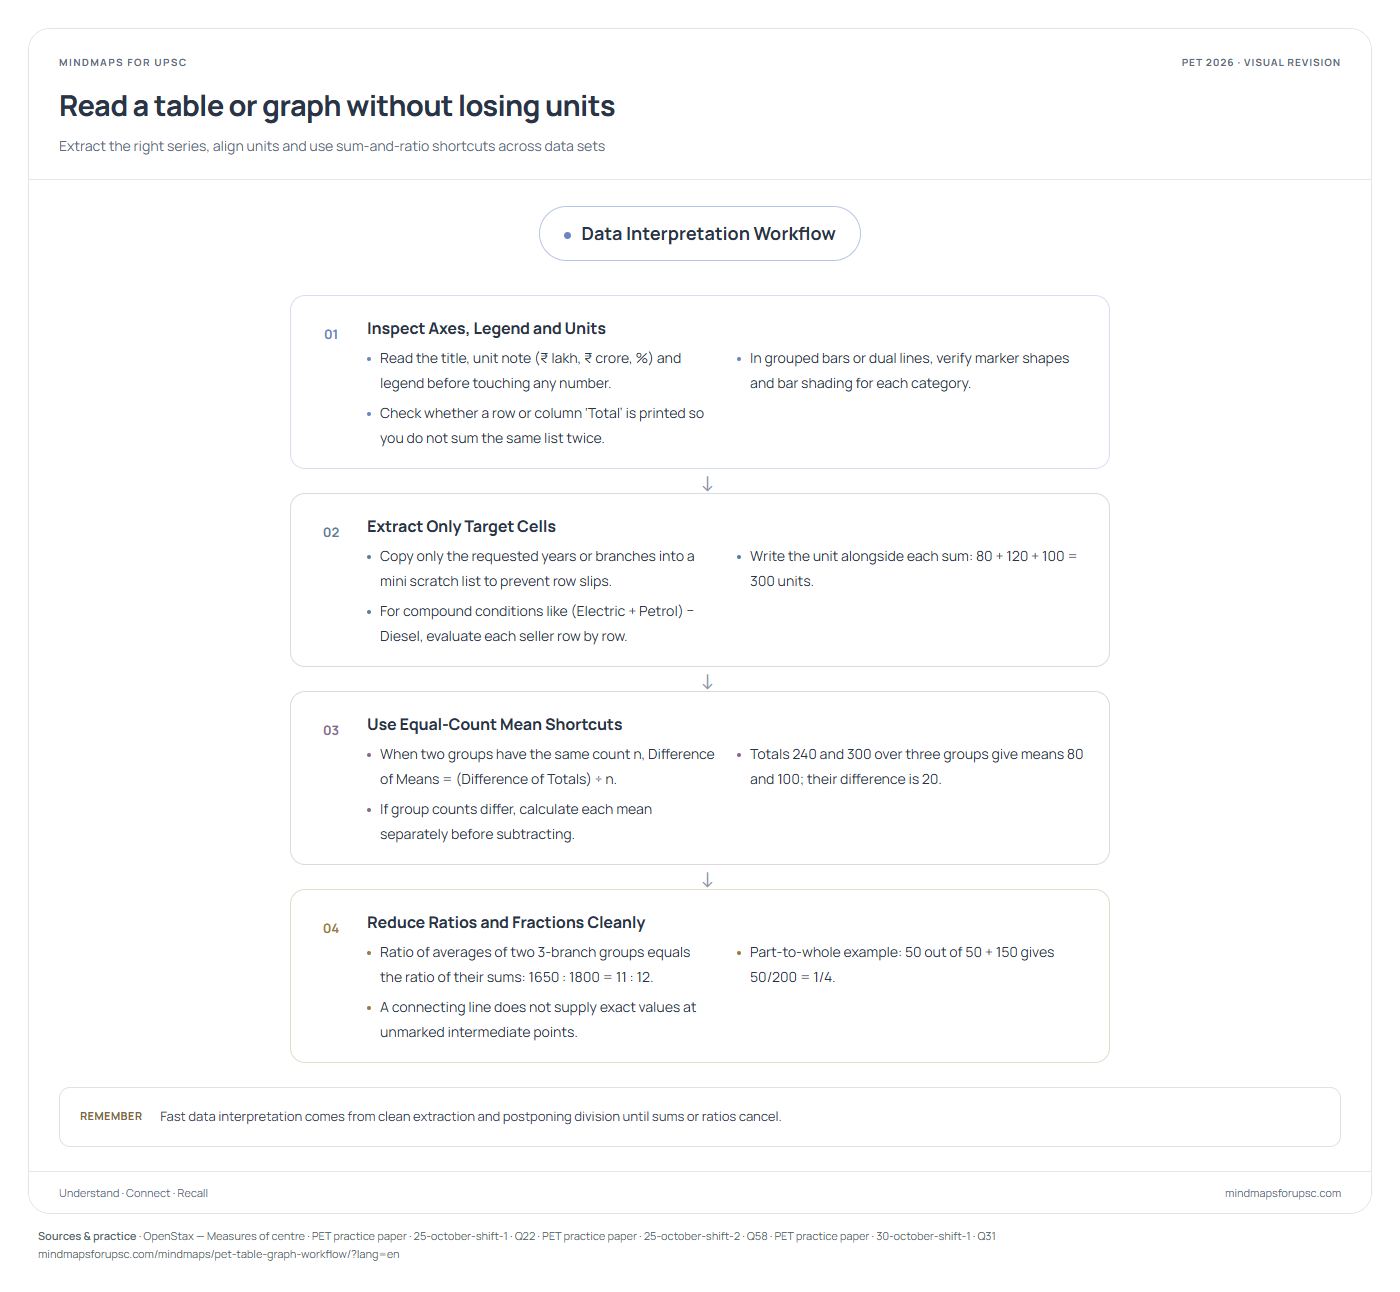
Read a table or graph without losing units इकाइयों की चूक किए बिना सारणी और आलेख पढ़ना Extract the right series, align units and use sum-and-ratio shortcuts across data sets सही श्रेणी चुनने, इकाइयाँ मिलाने और योग व अनुपात के संक्षिप्त नियमों का उपयोग करने की क्रमबद्ध विधि
01
Inspect Axes, Legend and Units
Read the title, unit note (₹ lakh, ₹ crore, %) and legend before touching any number. In grouped bars or dual lines, verify marker shapes and bar shading for each category. Check whether a row or column ‘Total’ is printed so you do not sum the same list twice.
02
Extract Only Target Cells
Copy only the requested years or branches into a mini scratch list to prevent row slips. Write the unit alongside each sum: 80 + 120 + 100 = 300 units. For compound conditions like (Electric + Petrol) − Diesel, evaluate each seller row by row.
03
Use Equal-Count Mean Shortcuts
When two groups have the same count n, Difference of Means = (Difference of Totals) ÷ n. Totals 240 and 300 over three groups give means 80 and 100; their difference is 20. If group counts differ, calculate each mean separately before subtracting.
04
Reduce Ratios and Fractions Cleanly
Ratio of averages of two 3-branch groups equals the ratio of their sums: 1650 : 1800 = 11 : 12. Part-to-whole example: 50 out of 50 + 150 gives 50/200 = 1/4. A connecting line does not supply exact values at unmarked intermediate points. Remember Fast data interpretation comes from clean extraction and postponing division until sums or ratios cancel.
01
अक्ष, संकेत-सूची और इकाइयाँ जाँचें
किसी भी संख्या को जोड़ने से पहले शीर्षक, इकाई (₹ लाख, ₹ करोड़, %) और संकेत-सूची अवश्य पढ़ें। समूहित दंड या द्वि-रेखा आलेख में प्रत्येक श्रेणी के चिह्न (वृत्त/वर्ग) और छायांकन की पुष्टि करें। देखें कि पंक्ति या स्तंभ में ‘कुल’ पहले से छपा है या नहीं, ताकि अनावश्यक दोबारा जोड़ न करना पड़े।
02
केवल अभीष्ट मानों की तालिका बनाएँ
पंक्ति या स्तंभ की चूक से बचने के लिए केवल पूछे गए वर्षों या शाखाओं के मान अलग लिख लें। हर योग के साथ इकाई लिखें: 80 + 120 + 100 = 300 इकाइयाँ। ‘(इलेक्ट्रिक + पेट्रोल) − डीज़ल’ जैसी संयुक्त शर्तों में प्रत्येक विक्रेता की गणना क्रमवार करें।
03
समान संख्या वाले माध्य के संक्षिप्त नियम
जब दो समूहों में पदों की संख्या n समान हो, तो माध्यों का अंतर = (कुल योगों का अंतर) ÷ n। तीन-तीन समूहों के योग 240 और 300 हों तो माध्य 80 और 100 हैं; उनका अंतर 20 है। समूहों की संख्या अलग हो तो घटाने से पहले हर समूह का माध्य अलग निकालें।
04
अनुपात और भिन्नों का सटीक सरलीकरण
समान संख्या (3-3 शाखाओं) के औसतों का अनुपात उनके योगों के अनुपात के बराबर होता है: 1650 : 1800 = 11 : 12। भाग-कुल उदाहरण: 50 और 150 के कुल में 50 का हिस्सा 50/200 = 1/4 है। जोड़ने वाली रेखा, बीच के अचिह्नित बिंदुओं के सटीक मान अपने-आप नहीं बताती।
Practise this concept · संबंधित प्रश्न One visual, several questions. These links open the original paper at the matching question.
Sources & study notes · स्रोत Independent revision material, linked to the paper’s concepts. The question papers and answer-key status are available on OpenPYQ.